
10 October 2024
National Farm Survey 2023 – Cereals Enterprise Factsheet
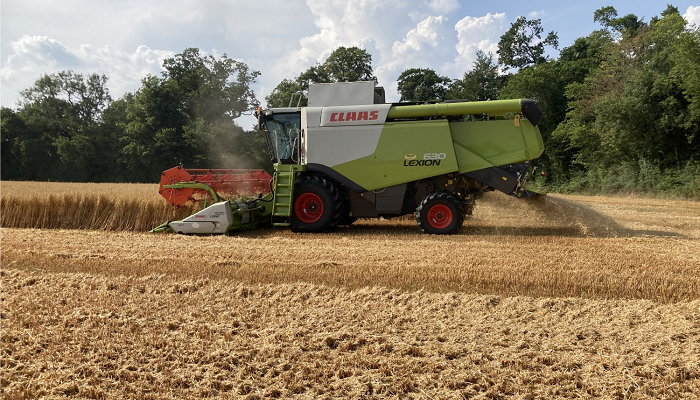
The recently published National Farm Survey 2023 Cereals Enterprise Factsheet summarises the results for the major cereal enterprises, namely winter wheat and spring barley. Included within is details on the production, cropping area, yield and costs of production for 2023.
Summary points – Irish cereal enterprise 2023 average performance
- Irish cereal production declined, totalling 2.02 million tonnes and down 21%;
- The Irish cereal area declined to 269,400ha, down 6%;
- The Irish barley area declined to 186,300ha, down 2%;
- The Irish wheat area declined to 55,800ha, down 17%;
- Spring barley price declined to an average of €217 per tonne, down 33%;
- Winter wheat price declined to an average of €224 per tonne, down 32%;
- Spring barley yield per hectare dropped to an average of 5.9 tonnes, down 18%;
- Winter wheat yield per hectare dropped to an average of 9.4 tonnes, down 4%;
- Total production cost per hectare for spring barley averaged €1,708, down 17%;
- Total production cost per hectare for winter wheat averaged €2,353, down 1%;
- Net margin for spring barley declined to an average of €215 per hectare, down €688;
- Net margin for winter wheat declined to an average of €60 per hectare, down €1,082;
- The target yield for spring barley of 7.2 tonnes per hectare was achieved on 15% of farms;
- The target yield for winter wheat of 10.3 tonnes per hectare was achieved of 22% of farms;
- The net margin target for spring barley of €150 per hectare was achieved on 21% of farms;
- The net margin target for winter wheat of €450 per hectare was achieved on 30% of farms.
Background
The 2023 National Farm Survey (NFS) recorded data on represents around 85,000 farms in Ireland. The financial results for these farms are available in the National Farm Survey 2023 report which is available here. This publication summarises the results for the major cereal enterprises (winter wheat and spring barley) on farms within the survey. In terms of representation for the following analysis, there were 86 farms with a spring barley enterprise in the survey in 2023, representing approximately 113,995 hectares. All farms with a cereal enterprise were included in this analysis. In previous years certain size restrictions were applied to this analysis, but due to sample size issues it was decided to not apply size restrictions to the analysis for 2023 results (and comparison figures for 2022).
Analysis of financial performance
In general, the yields per hectare achieved in 2023 compared to 2022 were lower. Cereal yields based on the NFS enterprise results across all farms, for spring barley, were down significantly, by 18%, while winter wheat yields decreased by 4%. In addition to the decrease in yields recorded for the aforementioned crops in the data, cereal prices were much also significantly lower in 2023 compared to 2022, with the price received at farm gate down over 30% for spring barley and winter wheat. The combined effect of the aforementioned factors resulted in a large decrease in gross output for spring barley and winter wheat, of 41% and 31% respectively, in 2023 compared to 2022.
Direct costs fell throughout the year, but timing of purchase continued to have an impact on the change in total direct costs on a year to year basis, with direct costs decreasing by 8% for spring barley but there was a further 9% increase in winter wheat direct costs in 2023. Allocated fixed costs decreased for both crops. Some of the decrease in the fixed costs allocated to the cereal crops is associated with the method in which fixed costs are allocated across enterprises. This allocation across each enterprise is based on the proportion of gross output. Given the change in output value, direct and fixed costs, the net margin on spring barley farms in 2023 was -€215 per hectare, down from €463 per hectare in 2022. The net margin for the winter wheat in 2023 was €60 per hectare, down from €1142 per hectare in 2022 (excluding decoupled payments).
Table 1: Average gross and net margin € per hectare: Spring Barley and Winter Wheat 2022/20231
| 2022 spring barley | 2023 spring barley | 2023 to 2022 % change | 2022 winter wheat | 2023 winter wheat | 2023 to 2022 % change | |
|---|---|---|---|---|---|---|
| Yield per hectare | 7 | 6 | -18% | 9.9 | 9.4 | -4% |
| Price per tonne | 324 | 217 | -33% | 330 | 224 | -32% |
| Gross output per hectare | 2,534 | 1,494 | -41% | 3,511 | 2,413 | -31% |
| Fert., seed, crop protection | 844 | 785 | -7% | 1,074 | 1,159 | 8% |
| Machinery hire | 271 | 260 | -4% | 195 | 220 | 13% |
| Other direct costs | 34 | 15 | -58% | 13 | 18 | 36% |
| Total direct costs | 1,150 | 1,060 | -8% | 1,285 | 1,400 | 9% |
| Gross margin | 1,384 | 434 | -69% | 2,226 | 1,013 | -55% |
| Fixed costs | 921 | 649 | -30% | 1,085 | 953 | -12% |
| Total costs | 2,070 | 1,708 | -17% | 2,370 | 2,353 | -1% |
| Net margin | 463 | -215 | -146% | 1,142 | 60 | -95% |
Source: Teagasc National Farm Survey 2023. 1 The estimates value of straw is based on market value prices minus variables costs of production.
Table 2 presents average gross and net margins per tonne of crop produced for 2022 and 2023. Total costs per tonne decreased for both spring barley and winter wheat in 2023, while price per tonne of cereals decreased substantially. The decrease in costs, coupled with the more significant decrease in price of cereals per tonne led to a decrease in the net margin per tonne for both spring barley and winter wheat.
Table 2: Average gross and net margin € per tonne of Spring Barley and Winter Wheat 2022/2023
| 2022 spring barley | 2023 spring barley | 2023 to 2022 % change | 2022 winter wheat | 2023 winter wheat | 2023 to 2022 % change | |
|---|---|---|---|---|---|---|
| Cereal price per tonne | 324 | 217 | -33% | 330 | 224 | -32% |
| Total gross output | 359 | 260 | -28% | 365 | 255 | -30% |
| Fert., seed, crop protection | 121 | 137 | 13% | 112 | 125 | 11% |
| Machinery hire | 40 | 44 | 9% | 24 | 24 | 1% |
| Other direct costs | 5 | 3 | -50% | 1 | 2 | 22% |
| Total direct costs | 167 | 184 | 10% | 138 | 151 | 10% |
| Gross margin | 192 | 76 | -60% | 227 | 103 | -54% |
| Allocated fixed costs | 132 | 113 | -14% | 108 | 88 | -18% |
| Total costs | 299 | 297 | -1% | 246 | 240 | -3% |
| Net margin | 60 | -37 | -161% | 119 | 15 | -87% |
Source: Teagasc National Farm Survey 2023
Variation in financial performance
The data in Tables 1 and 2 presents the average performance across farms and the tonnage of spring barley and winter wheat nationally. The wide variation in financial performance that occurs between different cereal producers throughout the country is not apparent. However, Table 3 shows the average costs of production and margin for farms and splits the sample into top and bottom performing spring barley farms on the basis of net margin per hectare.
Table 3: Variation in output and margin 2023: top and bottom performing spring barley farms
| Top | Bottom | % Difference between top and bottom | |
|---|---|---|---|
| Average crop area (hectares) | 24 | 12 | 96% |
| Yield (tonnes per hectare) | 6.1 | 5.7 | 8% |
| Price per tonne | 229 | 205 | 12% |
| Gross output (€ per hectare) | 1,622 | 1,368 | 19% |
| Fert., seed, spray (€ per hectare) | 690 | 878 | -21% |
| Machinery hire (€ per hectare) | 169 | 349 | -51% |
| Gross margin (€ per hectare) | 751 | 123 | 511% |
| Fixed costs (€ per hectare) | 610 | 687 | -11% |
| Total costs (€ per hectare) | 1,481 | 1,932 | -23% |
| Net margin (€ per hectare) | 142 | -564 | -125% |
Source: Teagasc National Farm Survey 2023
Total costs of production per hectare in the top performing spring barley group was 23% lower than the bottom performing spring barley producers. Gross output per hectare for the top half of spring barley farms was 19% higher than the bottom half. Overall, this results in a €706 per hectare difference in net margin per hectare between the bottom and top performing spring barley farms.
Table 4 shows the distribution of net margin per hectare on spring barley and winter wheat farms in 2023. In 2023, 65% of spring barley farms and 28% winter wheat farms (represented by the sample) produced a negative net margin, i.e., made a loss when allocated overhead costs were deducted from gross margins. At the opposite end of the distribution, 2% of spring barley farms and 12% of winter wheat farms earned a net margin of €750 or more in 2023.
Table 4: Distribution of net margin € per hectare: 2022 and 2023
| Net margin (€ per hectare) | Spring barley 2022 | Spring barley 2023 | Winter wheat 2022 | Winter wheat 2023 |
|---|---|---|---|---|
| <0 | 20 | 65 | 0 | 28 |
| 0-250 | 17 | 26 | 5 | 31 |
| 250-500 | 9 | 6 | 8 | 15 |
| 500-750 | 24 | 1 | 12 | 14 |
| >750 | 30 | 2 | 74 | 12 |
Source: Teagasc National Farm Survey 2023
Variation in technical performance
Table 5 presents average technical performance from 2021 to 2023 for a range of indicators. Technical performance decreased in many of the measures examined in 2023 relative to 2022. However, it is important to remember that these partial productivity indictors do not take cereal price and straw receipts into account. In addition, various Teagasc strategy documents have outlined a number of farm performance indicators for tillage crops for the year 2027. Table 6 shows the percentage of farms that achieved a selection of these targets in 2021, 2022 and 2023.
Table 5: Technical Performance Indicators Tillage Farms 2021-2023
| 2021 | 2022 | 2023 | |
|---|---|---|---|
| Spring barley land productivity (yield per hectare) | 7.2 | 7.2 | 5.9 |
| Winter wheat land productivity (yield per hectare) | 10.4 | 9.9 | 9.4 |
| Winter wheat crop protection (€ per tonne crop) | 27 | 32 | 38 |
| Land rent (€ per hectare spec. tillage farms) | 529 | 547 | 626 |
| Machinery hire (€ per hectare UAA spec. tillage farms) | 142 | 189 | 191 |
Source: Teagasc National Farm Survey 2023
Table 6: Percentage of farms achieving selected Teagasc Tillage 2027 Roadmap Targets
| Teagasc Roadmap Targets for 2027 | 2011 | 2022 | 2023 |
|---|---|---|---|
| Spring Barley yield ≥7.2t/hectare | 59 | 54 | 15 |
| Winter Wheat yield≥10.3/hectare | 66 | 43 | 22 |
| Winter Barley yield ≥10.0/hectare | 29 | 24 | 15 |
| Spring Barley yield ≥7.4 t/hectare (target for top 50%) | 57 | 52 | 13 |
| Winter Wheat yield ≥10.6t/ha (10%) | 17 | 14 | 15 |
| Winter Barley yield ≥10.2/hectare | 24 | 13 | 16 |
| Spring Barley Gross Margin ≥€650 per hectare | 84 | 87 | 33 |
| Winter Wheat Gross Margin ≥€1200 per hectare | 80 | 97 | 35 |
| Winter Barley Gross Margin ≥€1000 per hectare | 78 | 94 | 28 |
| Spring Barley Net Margin ≥€150 per hectare | 73 | 71 | 21 |
| Winter Wheat Net Margin ≥€450 per hectare | 76 | 92 | 30 |
| Winter Barley Net Margin ≥€375 per hectare | 73 | 78 | 18 |
More information
The 2023 Teagasc National Farm Survey (NFS) recorded data on 793 farms representative of around 85,000 farms nationally. These factsheets summarise the results from six enterprises.
The 2023 National Farm Survey Enterprise Factsheets on Dairy Beef, Single Suckling, Cattle Finishing, Sheep, Cereals and Dairy give a range of information including:
- Analysis of Financial Performance
- Average gross and net margin
- Profit per hectare for Top, Middle and Bottom one-thirds of farms
- Variation in Technical Performance
- Percentage of farms achieving Teagasc 2027 Road Map Targets
View the full suite of factsheets here.